


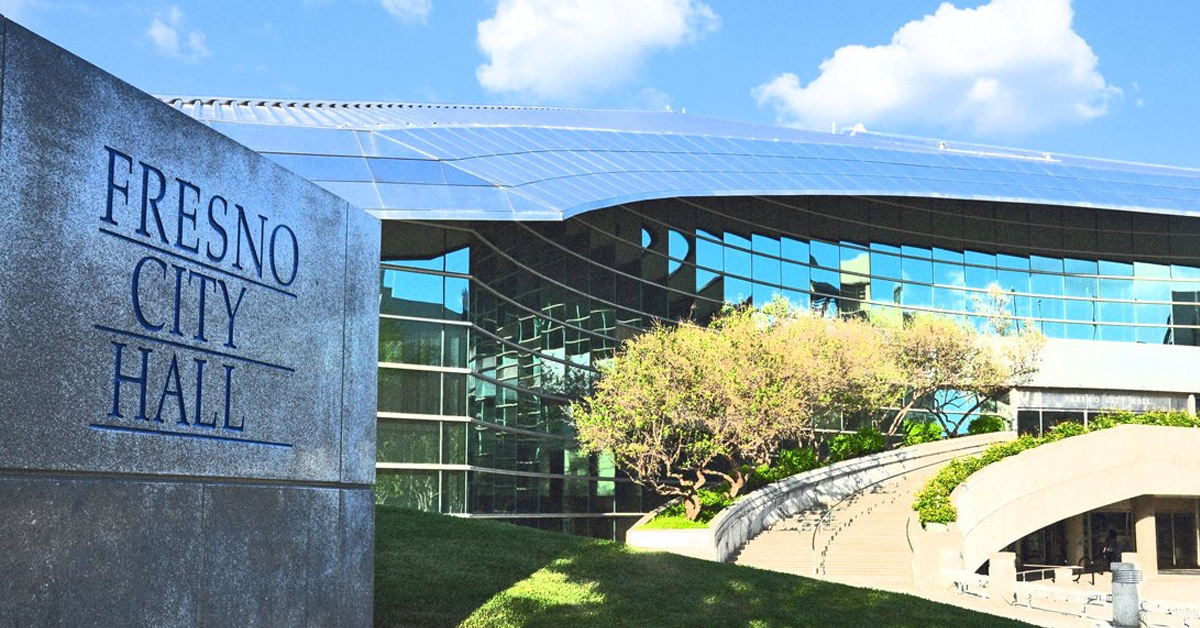
I took a walk early Thursday afternoon. My destination: Fresno City Hall. My purpose: Eat a big serving of crow in the presence of Mark Standriff.
ADVERTISEMENT
It wasn’t the first time I’ve made the trek to humble myself before the city’s communications director. I’m sure it won’t be the last.
I’m all too human.
You see, I wrote a story for CVObserver this week about pedestrian safety/pedestrian danger in our fair city. Standriff responded with a hard-hitting comment on CVObserver’s Facebook page.
The gist of Standriff’s response: I hadn’t done that most basic chore of journalism – double-check someone else’s “facts” before reporting them as the gospel.
Guilty as charged, Mark.
I listened Thursday afternoon at City Hall as Standriff explained to me where Washington, D.C.-based Smart Growth America had got things wrong (or less than precisely right) about pedestrian safety in Fresno.
In a nutshell, I had reported that the nonprofit had ranked Fresno as the nation’s 36th most dangerous city for pedestrians. (Fresno is the nation’s 34th largest city.)
Smart Growth America produced what it called a Pedestrian Danger Index. This index was used to put Fresno in the No. 36 spot.
Smart Growth America put its findings in a report titled “Dangerous by Design 2016.” The organization stated that Fresno suffered 190 pedestrian deaths in the 10-year period of 2005-2014.
Some of the communities ranked in the report clearly were metropolitan areas, rather than just the city itself. I didn’t read every word of the report. But I didn’t see anything that identified “Fresno” as actually being the “Fresno Metropolitan Area.”
The Fresno Metropolitan Area generally is defined as Fresno County. I’ve occasionally seen Madera County included in the definition.
Standriff, in his Facebook post, said the Smart Growth America report “uses old, unverifiable data that doesn’t reflect current safety conditions. For instance, City of Fresno data shows 59 pedestrian deaths between 2009-2014. To reach the total of 190 deaths in the 10 years that this survey touts, we would have to have averaged 30 pedestrian deaths per year between 2005-2008. But we don’t know for sure because we can’t see the yearly breakdown. Moreover, it doesn’t account for recent safety improvements made by the City of Fresno that resulted in ZERO pedestrian deaths in 2015. It looks like they’re including data from all of Fresno County as the metro which obviously skews the results of the study. It’s shame that we can’t see the whole picture.”
I walked home from City Hall thoroughly chastened. It was a seven-mile walk. I had plenty of time to chew on the rebuke.
After dinner I took a look at the Fresno Police Department’s 2015 Annual Report. It is posted on the city’s website.
“Dear Members of our Community,” Chief Jerry Dyer wrote in his introduction, “I am honored to give you an inside look at the 2015 accomplishments of the Fresno Police Department and share the on-going efforts to maintain the trust of the citizens of Fresno and to keep them safe.”
Page 27 of the 52-page report brought me to the Traffic Bureau’s summary of 2015.
“The Fresno Police Department saw a small increase of 1.0% in overall collisions and a 1.0% decrease in injury collisions,” the report states. “However, when we look at the big picture, the overall reductions are staggering in comparison to our traffic collision rates from the inception of our traffic program in 2002. Since 2002, injury collisions are down 44% and total collisions are down 40%.”
I thought: Congratulations to Deputy Chief Andy Hall and his dedicated officers. Fresno thanks you.
I also thought: You’re right, Mark. I should have read all this before I rushed into the story about the Smart Growth America report.
I continued reading about the Traffic Bureau in the Fresno Police Department’s 2015 Annual Report, posted on the city’s website.
“In 2015,” the report stated, “our department investigated 30 fatalities as opposed to the 35 fatalities that occurred in 2014.”
So far, so good.
“Of the 30 fatalities,” the report stated, “there were a total of 12 pedestrian deaths, a 29% decrease from 2014. 9 of the 12 pedestrians killed in 2015 (75%) were under the influence of alcohol or drugs at the time of the fatal collision. 67% of the deceased pedestrians were at fault in the collision that claimed their life and 83% of the pedestrians occupied a roadway outside of a marked or unmarked crosswalk when they were struck by a vehicle.”
For someone with the taste of crow still in his mouth, those three sentences made for interesting reading. The three sentences contain a lot of chatter about pedestrian death during a year that allegedly saw no pedestrian meet his Maker in an untimely manner.
The number “12” certainly caught my eye. Even without contacting experts, I’m pretty sure “12” is more than “zero.”
Make that “ZERO.”
The Traffic Bureau section in the 2015 report didn’t mention a specific number of pedestrian deaths in 2014, only that the 12 pedestrian deaths in 2015 (according to the police) constituted a 29% reduction from 2014’s total.
By my calculation, that means there were 17 pedestrian deaths in Fresno in 2014.
The city’s website features the Police Department’s annual reports from 2011 through 2015. I checked them out, specifically the Traffic Bureau summaries.
The 2011 report stated there were 15 pedestrian deaths during the year, up from 10 in 2010.
The Police Department annual reports posted on the city’s website report these pedestrian fatality figures for the years 2010 through 2014:
2010 – 10.
2011 – 15.
2012 – 16.
2013 – 11.
2014 – 17.
Total (by my calculation) – 69 for five years, or about 14 per year on average. And this comes after the Police Department, as stated in the annual reports, began emphasizing pedestrian safety campaigns in light of the 2011 spike in fatalities.
Near as I can tell, the 69 pedestrian fatalities in the five-year period 2010-2014 as reported by the Police Department is 10 more than the 59 pedestrian fatalities identified in the six-year period 2009-2014 by Standriff.
What to make of all this?
For starters, maybe the researchers at Smart Growth America weren’t full of beans. If Fresno averaged 14 pedestrian deaths annually from 2010-2014, then perhaps the city also averaged 14 per year from 2005-2009. If so, that would total 140 pedestrian deaths in 10 years.
Granted, that’s not the 190 stated by Smart Growth America. But maybe some or all of the difference is explained by deadly collisions occurring in county islands within Fresno’s boundaries.
Another possible takeaway is that the Fresno Police Department’s annual reports are full of nonsense. Or perhaps the Police Department’s definition of “pedestrian death” is different than the definitions employed by Smart Growth America and Fresno’s communications director.
I know only this: I’ve learned my lesson. I’m going to double-check all the “facts” I can.
I’ll start with this one: 12 is more than zero.
Oops.
ZERO.


I hope you pointed out the PD’s official numbers to Mark afterwards.
Those numbers that Standriff took exception to could include the County islands. They may also include pedestrian fatalities on the local freeways that CHP investigated-we have four or five a year typically. Train versus pedestrian fatalities too (though I class most of those as suicides). I suspect the total number of all those added to 140 could equal 190.
Great article. As a four-mile-a-day pedestrian myself, I appreciate the in depth look, no matter how numbers are arrived at.